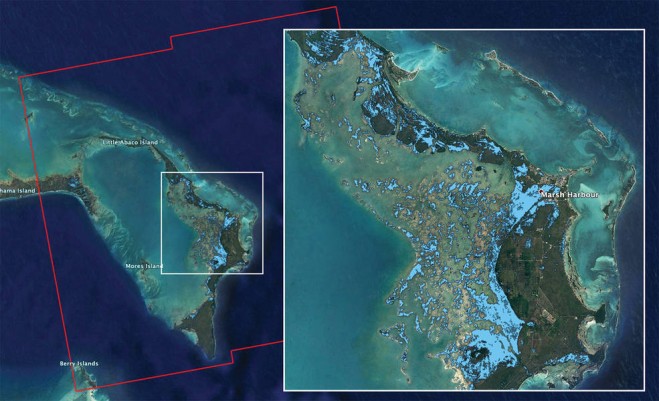
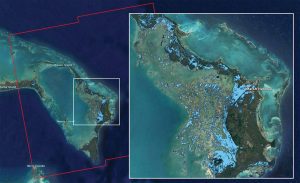
 The Advanced Rapid Imaging and Analysis (ARIA) team at NASA’s Jet Propulsion Laboratory in Pasadena, Calif., in collaboration with the Earth Observatory of Singapore (EOS), used synthetic aperture radar data from the European Union’s Copernicus Sentinel-1 satellites to produce this flood map of the Bahamas. The light-blue color indicates areas that were likely flooded when the data were acquired on Sept. 2, 2019. In particular, the map shows flooding in and around Marsh Harbour in the Abaco Islands.
The map covers an area of about 109 miles by 106 miles (176 kilometers by 170 kilometers) shown by the large red polygon. Each pixel measures about 32 yards (30 meters) across. Authorities and responders can use flood maps like this one as guidance to identify areas that are likely experiencing flooding; the map may be less reliable over urban or vegetated areas.
The image contains modified Copernicus Sentinel data (2019) processed by ESA and analyzed by NASA, JPL-Caltech, ARIA, and EOS. This work was funded by NASA along with the Earth Observatory of Singapore and a Singapore National Research Foundation Investigatorship.